Digital Nomad Statistics 2024 By Demographics, Gender, Background, Salary, Education Level, Nationality And Preferred Activities
8 min read
Page Contents
Introduction
Digital Nomad Statistics: Making money on the move and traveling is what a digital nomad does. These people travel for longer periods and work remotely. After COVID-19, as the need for remote work increased, the opportunity for travelers began to flourish. After the lockdown, the number of digital nomads increased by 50% and today it is still rising. Again thanks to the technology which is making it possible. The basic need for any of this travel is Wifi which enables remote working during travel. Becoming is digital nomad is somewhat costly but worth every penny. Check out below the Digital Nomad Statistics and understand their lifestyle.
Editor’s Choice
- 90% of digital nomads are educated. Whereas, 35% are employed and 46% are self-employed.
- As of 2023, Digital Nomad Statistics showed that the total number of nomads reached 35 million around the globe, out of which 17.3% are Americans.
- 46% of digital nomads are less likely to earn as they used to earn when employed in corporations.
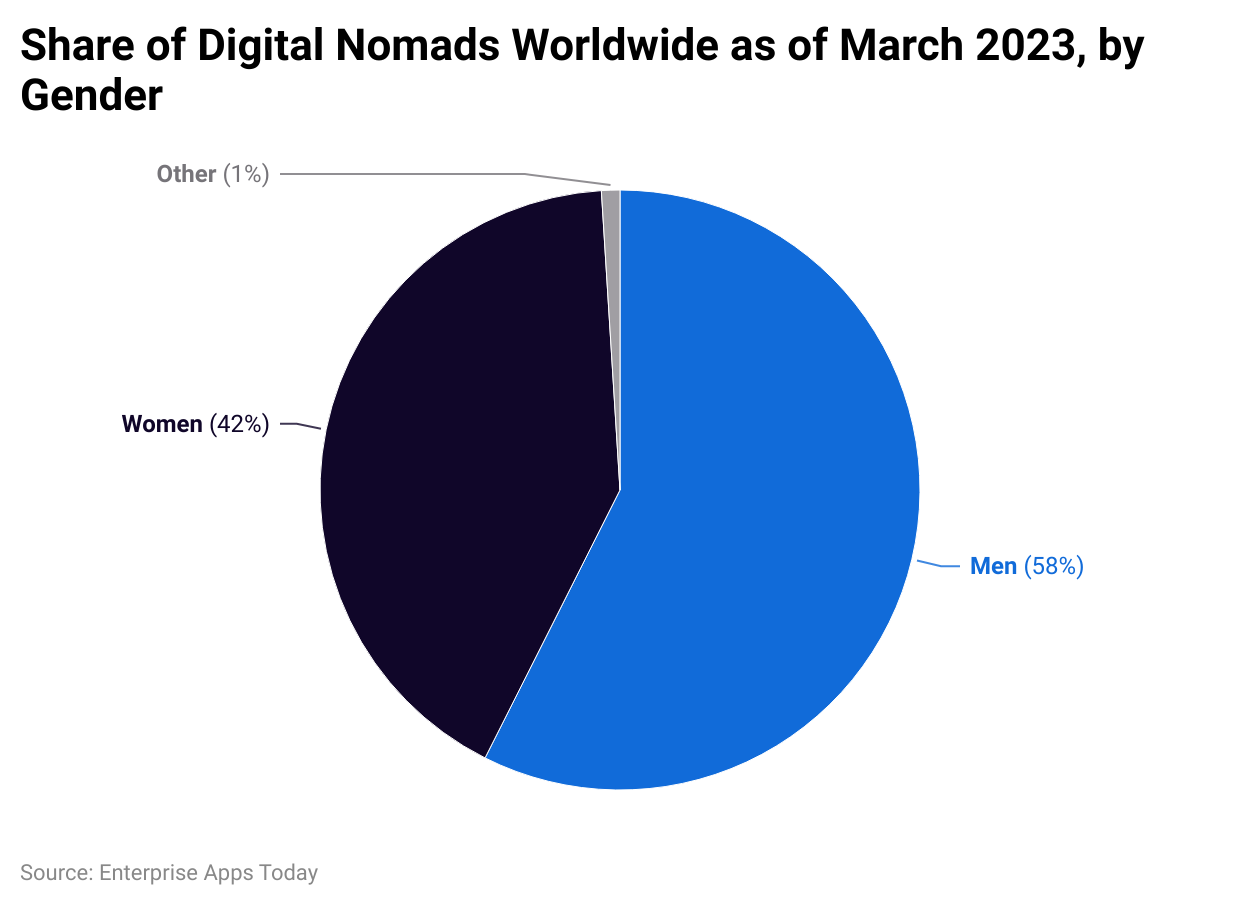
- As of March 2023, most digital nomads were male resulting in 58%, whereas females contributed 42%. Others included 1% of all.
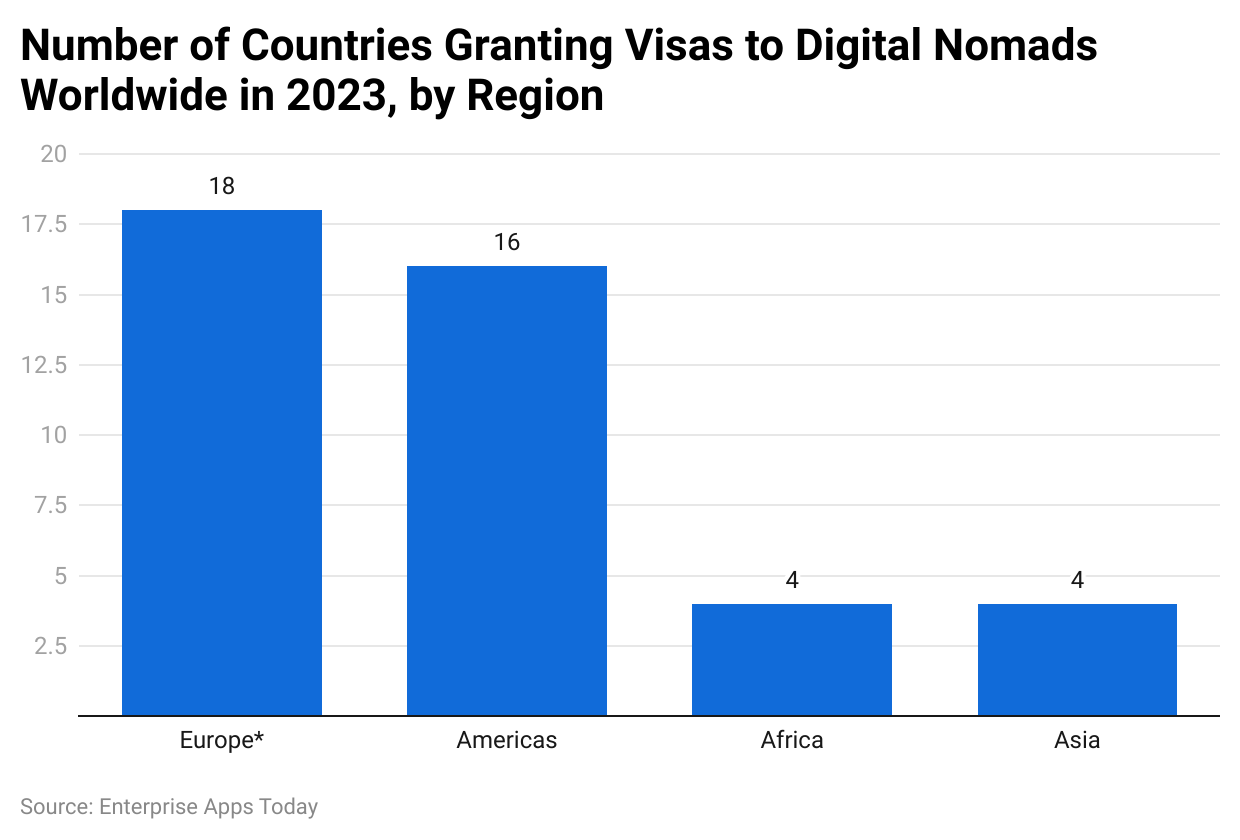
- Most of the visas were granted for Europe visits resulting in 18%. Surprisingly, considering the most visited cities, the Americas ranked second for the same with 16%.
- 66.7% of digital nomads are interested in friendships while 33.3% are interested in relationships.
- The majority of the digital nomads earn $50k to $100k a year resulting in 34%. Furthermore, there are 2% of them earning more than $1 million annually.
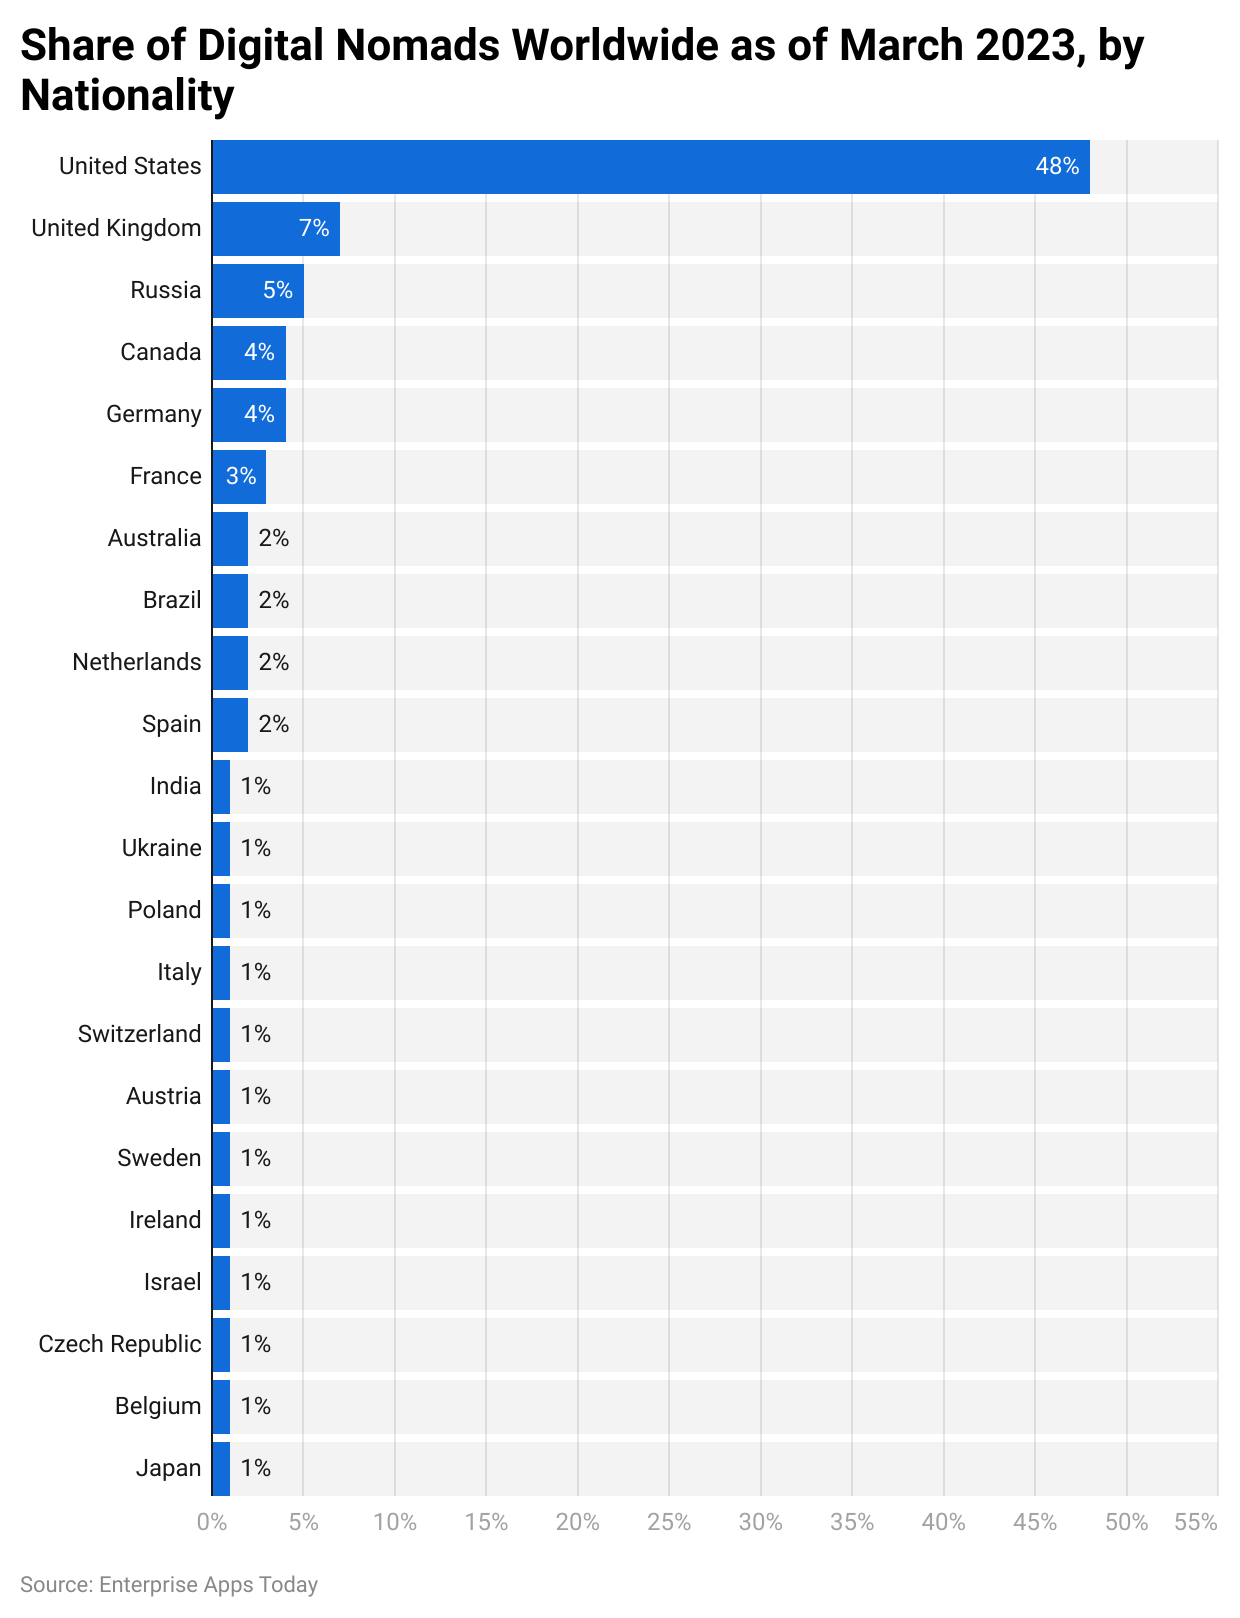
- Nationality-wise a large number of digital nomads are based in the United States of America contributing 48%.
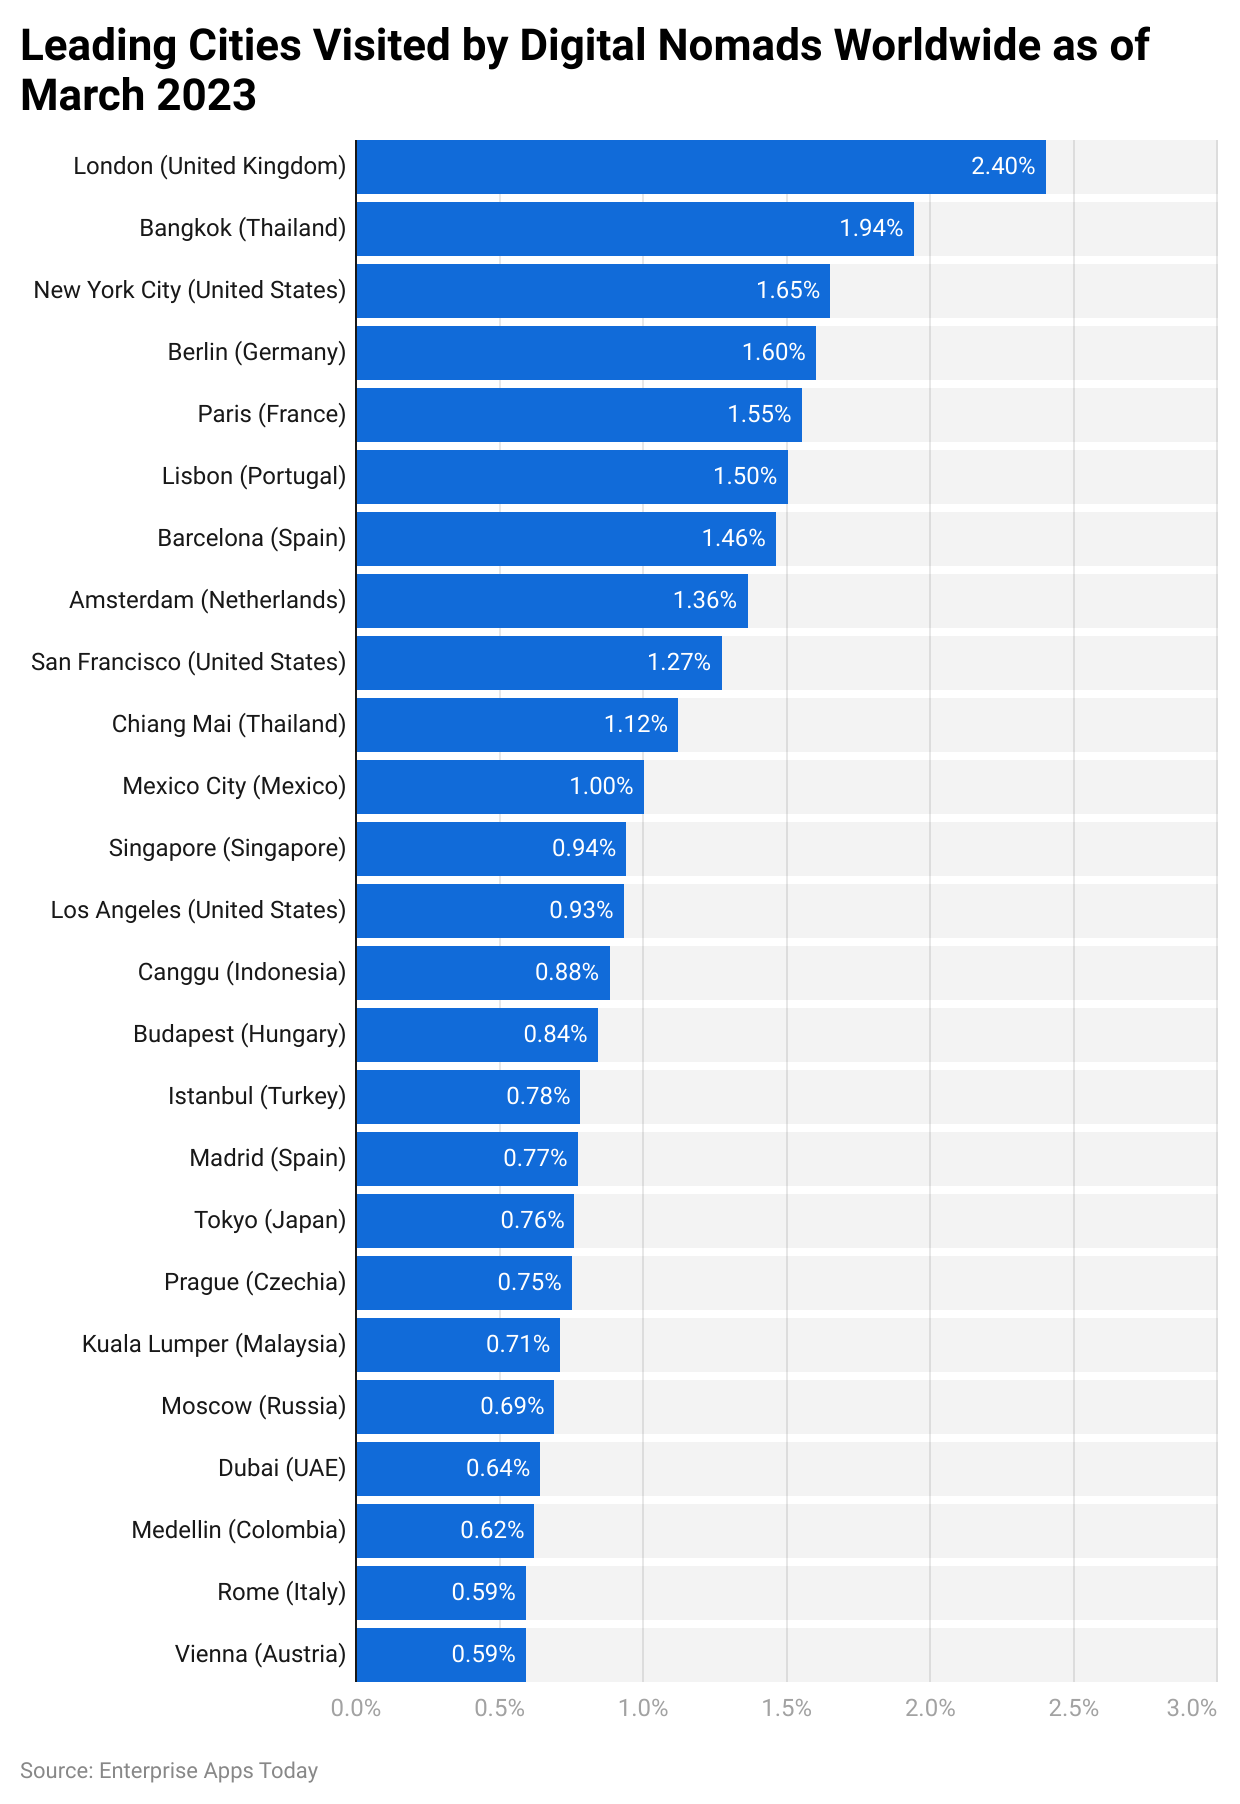
- As of March 2023, London, Bangkok, and New York were the top 3 most visited cities by digital nomads, resulting in 2.4%, 1.94% and 1.65% of trips.
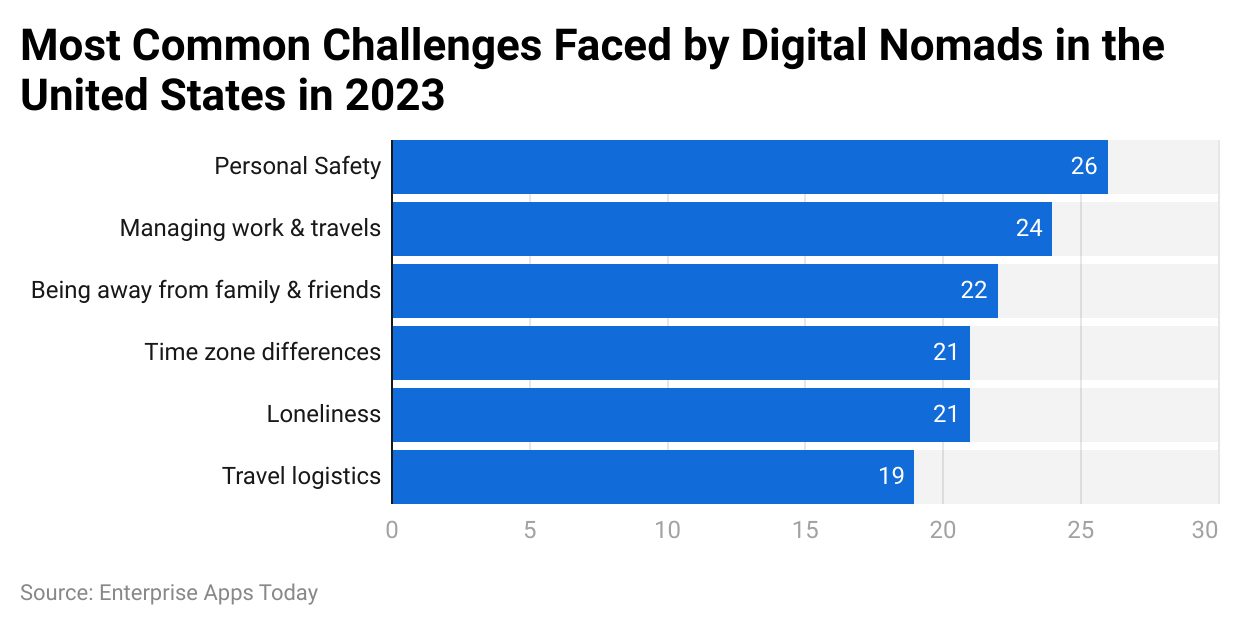
- The topmost concern experienced by digital nomads is personal safety. However, balancing work and travel is the second concern.
General Digital Nomad Statistics
- As of 2023, Digital Nomad Statistics showed that the total number of nomads reached 35 million around the globe, out of which 17.3% are Americans.
- In 2022, the most preferred workplace for these types of travelers around the world was accommodation or home.
- The deciding factor for selecting a location for worldwide digital nomads is easy access speed of the internet and the cost of living.
- The majority of the digital nomads are working as either freelancers, online entrepreneurs, bloggers content creators, or freelancers.
- On average, a digital nomad is aged 32 years.
- 66.7% of digital nomads are interested in friendships while 33.3% are interested in relationships.
- 90% of digital nomads are educated. Whereas, 35% are employed and 46% are self-employed.
- Digital Nomad Statistics say that the median salary for a digital nomad is $85,000 while the average salary per year is $120,512.
- 46% of digital nomads are less likely to earn as they used to earn when employed in corporations.
- On average, living as a digital nomad incurred a living cost of $1,724.
- Every year, these travelers travel with a budget resulting in 46%. However, the majority of them don’t even have any budget issues (54%).
- 47% of digital nomads are satisfied with their chosen lifestyle.
- On average, these people visit 1 to 2 countries per year resulting in 73% of travelers. 19% travel to 3 to 4 while 8% visit more than 5 countries.
- Around 45% of digital nomads prefer to work from cafes regularly.
- 48% of American digital nomads prefer to travel outside boundaries while 52% prefer to stay within the boundaries.
- 40% of digital nomads generally go through feelings of loneliness.
- The average total spend studied by Digital Nomad Statistics is $787 billion a year.
- Furthermore, 6 months is the average duration to move to a new country for these travelers.
- Half of the digital nomads have travelers on the road for 4 years or less.
- 66% of digital nomads generally stay in a single place while 80% of nomads stay for 3 to 9 months.
- 74% of digital nomads said traveling in between increased their productivity at work.
- 98% of digital nomads are more likely to work remotely for the rest of their lives.
Digital Nomad Statistics by Demographics
By Gender
 (Reference: statista.com)
As of March 2023, most digital nomads were male resulting in 58%, whereas females contributed 42%. Others included 1% of all.
By Background
| Racial Distribution of Digital Nomads (2023) | In % |
|---|---|
| White | 73% |
| African American | 18% |
| Hispanic | 11% |
| Asian | 4% |
| Another background | 3% |
(Source: photoaid.com)
According to Digital Nomad Statistics by ethnic background, a large number of these travelers belong to white racial distribution contributing 73% of the total. 18% and 11% respectively belong to African Americans and Hispanics. However, there are only 4% of Asian digital nomads as of 2023.
By Salary
| Annual Income Range | Percentage (%) Of Digital Nomads |
| Less Than $25k | 7% |
| $25k – $50k | 17% |
| $50k – $100k | 34% |
| $100k – $250k | 33% |
| $250k – $1M | 7% |
| Over 1+ Million | 2% |
(Source: twoticketsanywhere.com)
The majority of the digital nomads earn $50k to $100k a year resulting in 34%. Furthermore, there are 2% of them earning more than $1 million annually. Other salary groups have the following contributions less than $25k and $250k to $1 million (7%), $25k to $50k (17%), and $100k to $250k (33%).
By Education Level
 (Reference: statista.com)
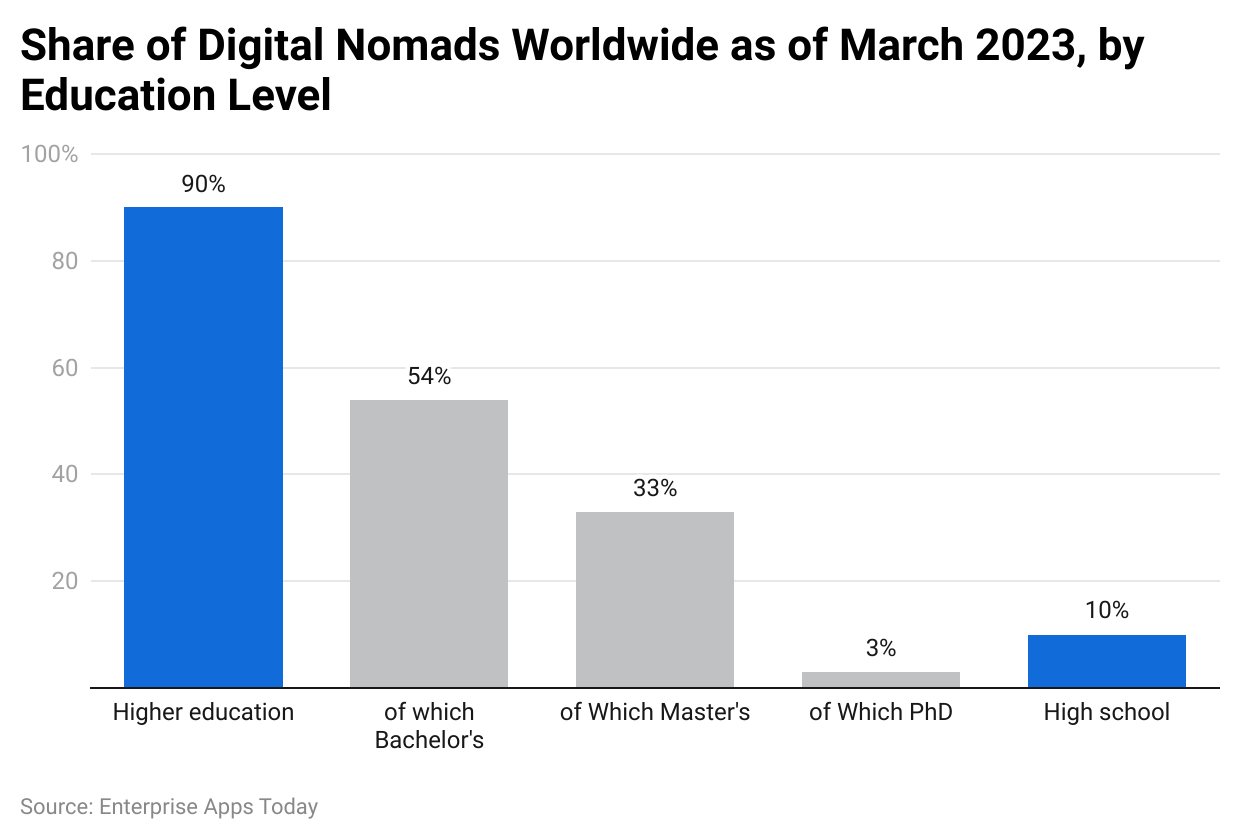
Digital Nomad Statistics by Demographics 2023 further state that 90% of them have higher education contributing 90%, of which 54% have bachelor’s and 33% have master’s. Only 3% of digital nomads have PhD and 10% earned their high school degree.
By Nationality
 (Reference: statista.com)
Furthermore, nationality-wise a large number of digital nomads are based in the United States of America contributing 48%. The United Kingdom and Russia are the top 2 countries with the highest digital nomads. Other countries have just 1% of the contribution.
By Generation
 (Reference: statista.com)
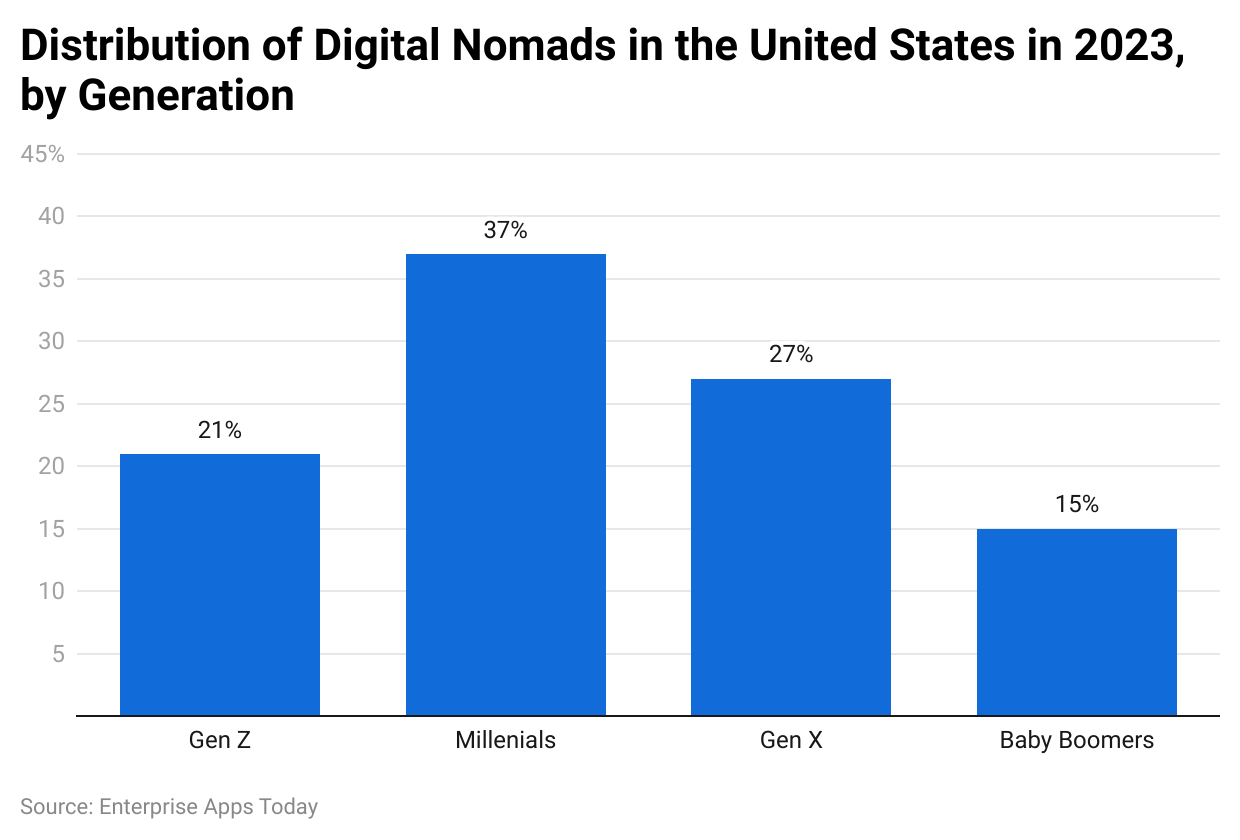
As of 2023, in the United States, a huge number of nomads were seen in the millennials contributing 37%, followed by Gen X (27%). There were 21% and 15% of nomad travelers in Gen Z and Baby Boomers respectively.
By Most Common Professions
 (Reference: statista.com)
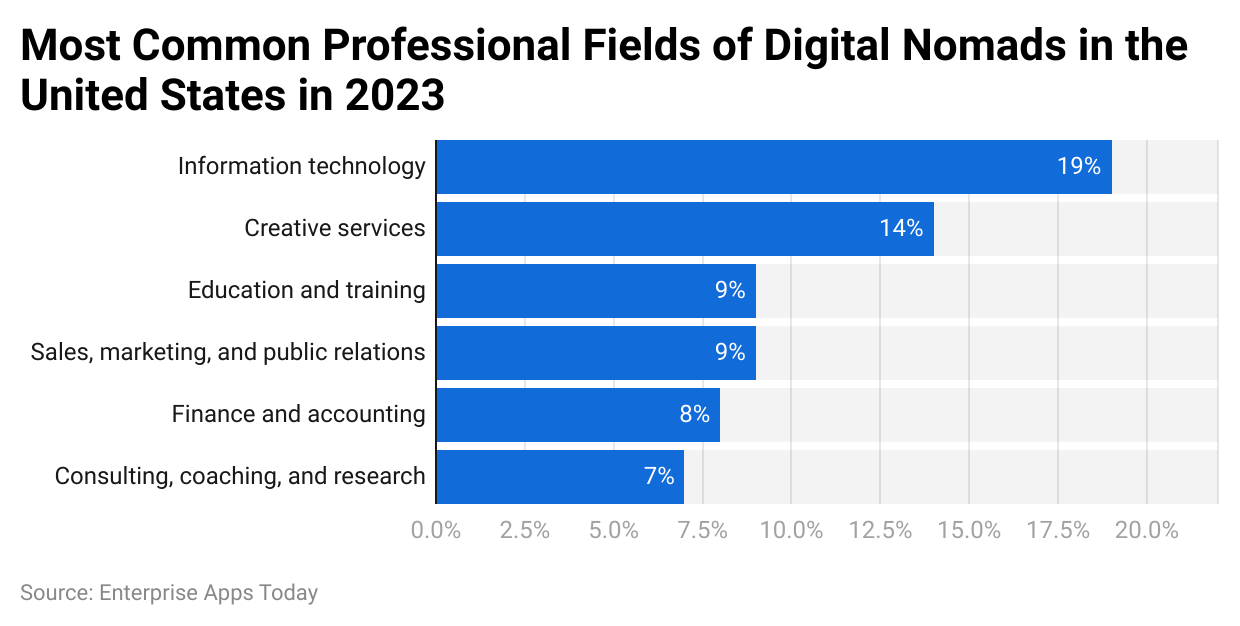
As of March 2023, Information technology was the leading profession of the majority of the digital nomads resulting in 19%. Creative services and education and training were other commonly seen professions contributing 14% and 9% respectively. People were working in finance and accounting, sales, marketing and public relations, and research, coaching, and consulting.
By Age Wise
| Age Range | Percentage of Digital Nomads |
| 20 to 29 | 14% |
| 30 to 39 | 47% |
| 40 to 49 | 16% |
| 50 to 59 | 19% |
| 60 to 69 | 3% |
| 70 and above | 1% |
(Source: twoticketsanywhere.com)
The age-wise distribution of digital nomads states that the majority of them belong to the age group 30 to 39 years resulting in 47%. Other people who enjoy working while traveling are 50 to 59 years (19%), 40 to 49 years (16%), 20 to 29 years (14%), 60 to 69% (3%), and 70 and above (1%.)
By Preferred Activities
| Sport | % of nomad women | % of nomad men |
|---|---|---|
| Hiking | 52% | 49% |
| Yoga | 45% | 21% |
| Fitness | 40% | 47% |
| Swimming | 24% | 24% |
| Running | 21% | 29% |
| Cycling | 18% | 26% |
| Diving | 15% | 16% |
| Surfing | 15% | 18% |
| Climbing | 13% | 16% |
(Source: demandsage.com)
According to Digital Nomad Statistics, the top 3 most preferred activities by nomad women are hiking (52%)m Yoga (45%), and Fitness (40%) while for men it is Hiking (49%), Fitness (47%) and Running (29%). The least preferred activities by men and women are Climbing and diving respectively.
By Top Occupations
 (Reference: statista.com)
 (Reference: statista.com)
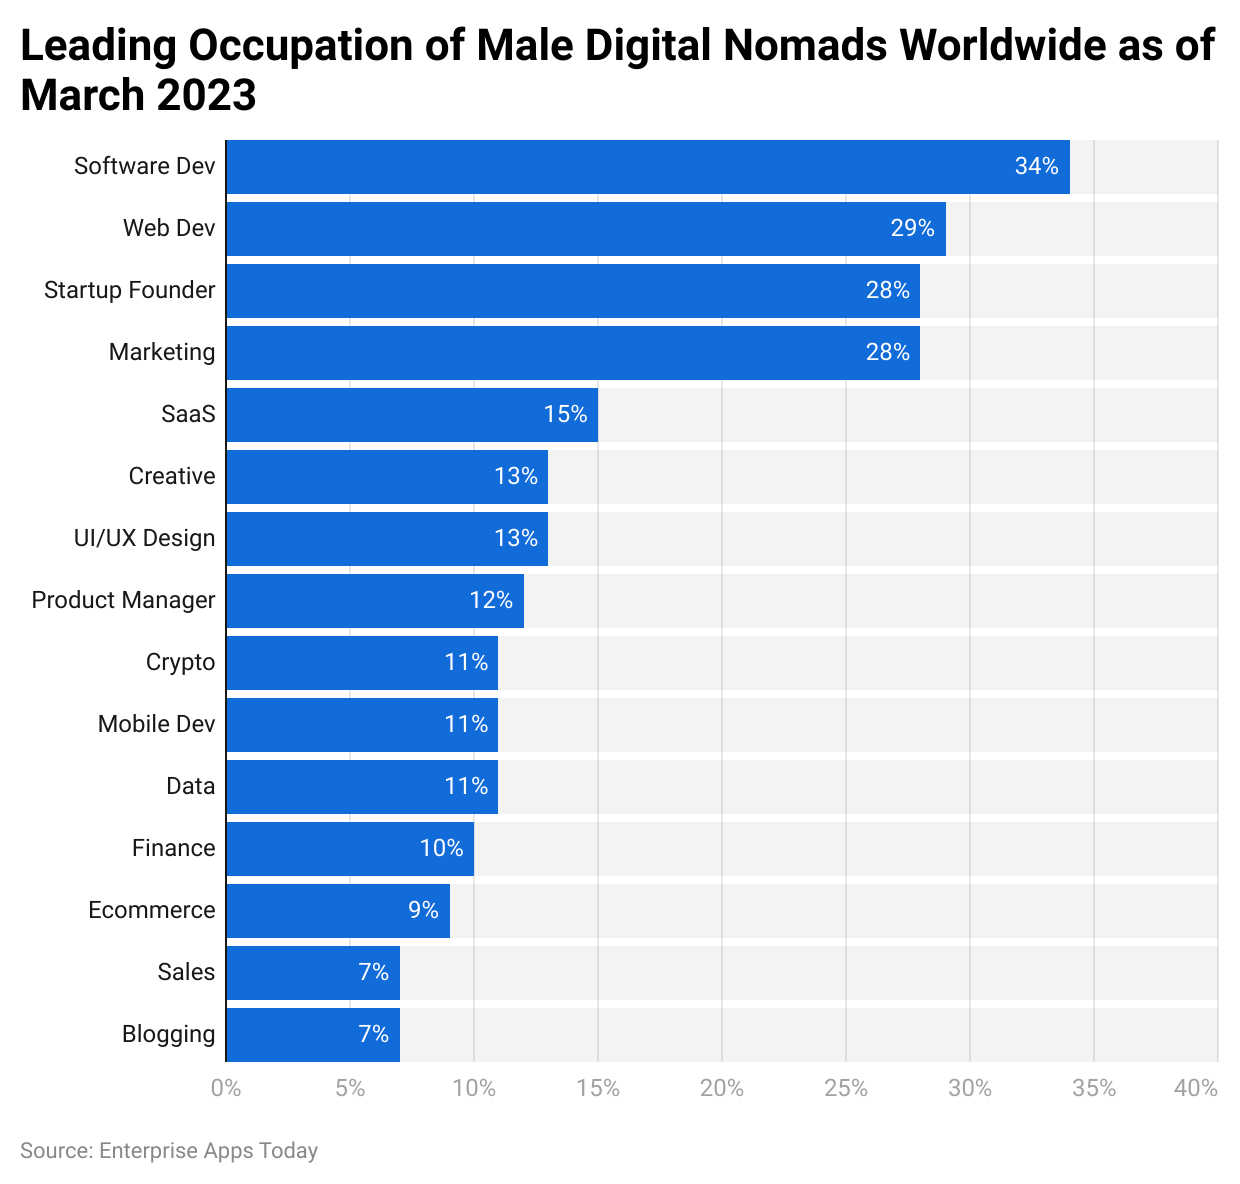
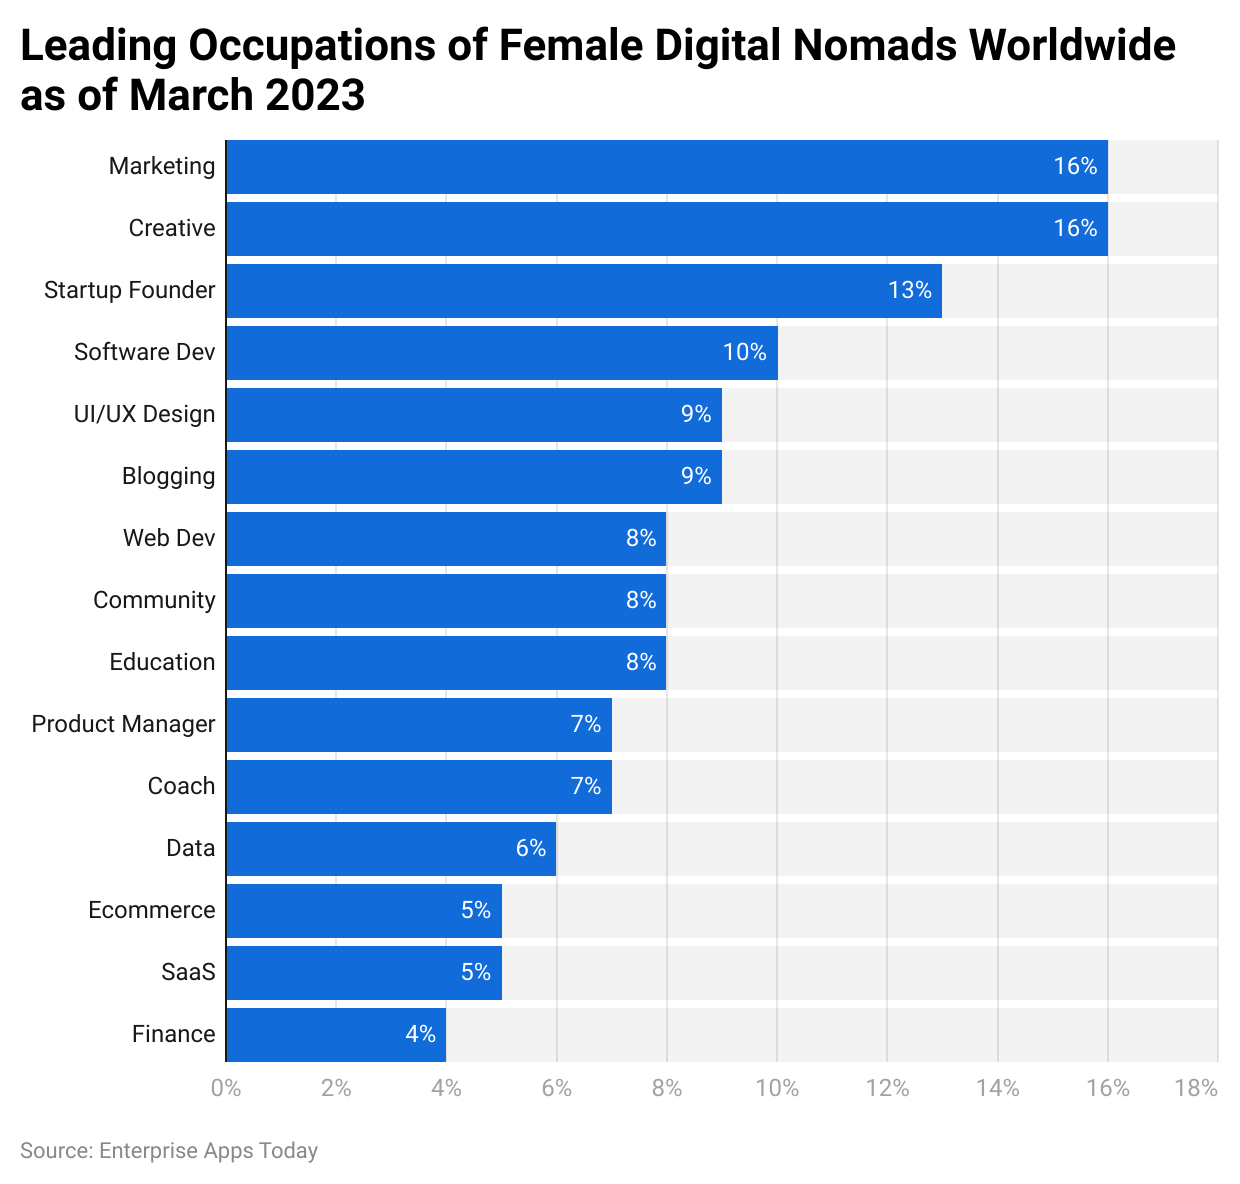
As of March 2023, comparing men and women, the leading occupations are Software dev (34%), Web Developer (29%), and Startup founder (28%) for men, and marketing (16%), Creative (16%) and Startup founder (13%) for women. For men Blogging and women women Finance are the least common occupations resulting in 7% and 4% respectively.
by Accommodation Type
| Accommodation Type | Percentage Of Digital Nomads |
| Airbnb | 44% |
| Hostel | 37% |
| Coliving | 16% |
| Hotel | 2% |
| Other | 1% |
(Source: twoticketsanywhere.com)
The most preferred type of accommodation by digital nomads is Airbnb (44%). Surprisingly, 37% prefer a hostel while 16% choose coliving. Only 2% prefer hotels. On the other hand, 1% of travelers have other types of preferences.
by Living Cost
| Category | COST ($USD) |
| Accommodation | $821 |
| Groceries | $336 |
| Dining Out | $285 |
| Transport | $71 |
| Phone Plan | $26 |
| Activities & Entertainment | $89 |
| Gym Memberships | $96 |
(Source: twoticketsanywhere.com)
Digital nomads generally have to pay different costs per month. The major amount is paid in accommodation ($821), followed by groceries ($336) and dining out ($285). However depending on the choice, the lowest cost is incurred for the phone plan ($26).
by Reasons to be a Digital Nomads
- 73% said they wanted a better work-life balance
- 68% said they love the freedom of the lifestyle
- 55% said they just love to travel
- 43% said they wanted to avoid office politics
- 37% said they had a desire to explore other cultures
(Source: twoticketsanywhere.com)
The top reason given by digital nomads to live this lifestyle is to have a better work-life balance resulting in 73%. 68% of them said it allows them freedom of the lifestyle. 55% of nomads chose to be so because they love to travel, while 43% wanted to avoid office politics. Almost 40% of nomads simultaneously wanted to explore other cultures.
by Leading Cities Visited in 2023
 (Reference: statista.com)
As of March 2023, London, Bangkok, and New York were the top 3 most visited cities by digital nomads, resulting in 2.4%, 1.94% and 1.65% of trips. Choices for trips to other cities included San Francisco, and Los Angeles in the USA.
by Concerns
 (Reference: statista.com)
The topmost concern experienced by digital nomads is personal safety. However, balancing work and travel is the second concern. The least yet voted concern by these types of travelers is travel logistics.
by Countries Granting Visa by Region
 (Reference: statista.com)
Digital Nomad Statistics 2023 shows that most of the visas were granted to Europe visits resulting in 18%. Surprisingly, considering the most visited cities, the Americas ranked second for the same with 16%. Furthermore, Africa and Asia similarly shared the percentage of granted visas at 4%.
by Dating Requirements
| Looking For | Percentage (%) |
| Friends | 35% |
| Travel Buddies | 32% |
| Casual Dating | 16% |
| Relationships | 13% |
| Poly Dating | 5% |
(Source: twoticketsanywhere.com)
Out of all the digital nomads, 35% are looking for friends, while 32% are searching for travel buddies. 16% are in search of casual dating, on the other hand, 13% are looking forward to relationships. 5% are interested in poly dating.
by Places of Working
| Place To Work | Percentage (%) |
| Apartment/Hostel | 46% |
| Cafes | 45% |
| Airbnb | 27% |
| Coworking Spaces | 19% |
(Source: twoticketsanywhere.com)
Apartments or Hotel and Cafes are the most chosen spots to work by digital nomads. Furthermore, Digital Nomad Statistics state that, 27% use Airbnb and 19% prefer coworking spaces to complete their office work.
Conclusion
Looking at the current worldwide situation with different series of viruses, companies are more likely to provide forever remote work. Thus resulting in an increased number of digital nomads around the world. However, other than the USA, people in other countries have yet to adopt this lifestyle.
If we consider these Digital Nomad Statistics 2024, there has been a tremendous increase in the number of these travelers. Working and simultaneously traveling is the dream of many. However, this lifestyle can not afforded by everyone, and this is the main reason for not having a large number of digital nomads in developing countries.
What is a digital nomad?
An individual who earns money while traveling to various destinations and staying at the same place for longer periods is called a digital nomad. Usually, these individuals work remotely.
How to become a digital nomad?
It all starts with a remote job to become a digital nomad. Even though it seems fun to be one, it is financially costly to travel across various destinations with daily charges of living. In case, you have a huge amount of savings plus a remote job then you are good to go. Moreover, a digital nomad needs to have a different kind of attitude to adapt to a completely new lifestyle. Thus before choosing this lifestyle, ensure you have enough money, the ability to work certain hours a day, the ability to adjust to various places, and the ability to work on various things independently.
Can you travel in a camper and become a digital nomad?
Yes. Why not! It is having your home traveling with you while you work. It is also possible to run a business from a camper and earn for living.

Barry Elad
Barry is a lover of everything technology. Figuring out how the software works and creating content to shed more light on the value it offers users is his favorite pastime. When not evaluating apps or programs, he’s busy trying out new healthy recipes, doing yoga, meditating, or taking nature walks with his little one.


